On January 11, 2024, the Center for Election Confidence (CEC) issued a report titled “Minority Electorates and Ranked Choice Voting,” authored by Princeton political scientist Nolan McCarty.[1] The CEC report documented how ranked-choice voting (RCV) reduces minority voting influence due to disproportionate ballot exhaustion rates in minority voting precincts.
In response to CEC’s report, on January 16, 2024, FairVote, the leading advocate for RCV, countered with a report titled “Ranked Choice Voting Elections Benefit Candidates and Voters of Color: 2024 Update.”[2] FairVote’s report (which follows a similar one released in 2021) makes several claims about the positive impact of RCV on minority and female candidates and its benefits for voters of color.[3] FairVote’s claims are based on superficial or in some cases specious analysis, and FairVote ignores the contrary findings of Professor McCarty and others who have found statistically significant harms of RCV for minority voters.
FairVote’s claims include the following:
- “Candidates of color continue to benefit from the RCV counting process.”
- “Candidates of color pay no penalty when they run against other candidates of the same race or ethnicity.”
- “Voters of color continue to demonstrate the tendency to rank more candidates than White voters.”
- “Naturalized citizens and permanent residents support ranked choice voting and proportional representation.”
These claims are misleading. In each case, the evidence offered does not meet social-scientific standards for supporting the inferences. In more extreme cases, the data has been cherry-picked to reach the desired conclusions. Moreover, the report’s reasoning is often conceptually confused – such as when it postulates a benefit of RCV to minority communities which may in actuality be evidence of harmful racially polarized voting.
This paper shall examine and analyze the claims made in FairVote’s report.
1. Historic Election Outcomes Using RCV
In the section entitled “Historic Election Outcomes Using RCV,” FairVote argues that the introduction of RCV has “has contributed to many historic wins, with candidates of color and women gaining more representation in federal, state, and municipal offices.” The report makes the following empirical claims:
- An increase in the number of women and people of color elected to the NYC Council between 2017 and 2021 following the introduction of RCV (Figure 2);
- A council majority of people of color in Salt Lake City following the introduction of RCV in 2021;
- The numbers of people of color and women on the city councils of St. Paul, Minneapolis, New York City, and Salt Lake City are larger now than they were prior to the adoption of RCV (Figures 3 and 4).
The evidence presented in this section is far from conclusive and may be misleading for a number of reasons. First, the cities cited in these examples are not a representative sample of all RCV cities and appear to have been chosen precisely because there was an observed increase in minority and female representation after RCV was adopted. Social scientists refer to this as selection bias. Second, the RCV cities are not compared with similar non-RCV cities to assess what might have happened if those cities had not adopted RCV. In other words, the analysis lacked a control group. Third, with the exception of New York City, there is no effort to show that the changes in minority and female representation are contemporaneous with the adoption of RCV. Of particular concern is that minority or female representation may have been trending upward at the time of adoption which would create a spurious correlation between adoption and representation.
We also note that FairVote does not control for changes in the racial and ethnic makeup of RCV cities, and does not consider possible effects of redistricting on minority representation. These factors could explain election results wholly independent of RCV.
The problems of selection bias, the omission of a control group, and spurious correlation analysis may lead to erroneous conclusions about RCV. Data from the American Local Government Elections Database illuminates these errors. We use their data to plot the longer-term trends in minority and female city council representation for several of the cities in the FairVote report as well as those for a control group of similar non-RCV cities.[4] The FairVote cities are New York, New York; Saint Paul, Minnesota; and Minneapolis, Minnesota.[5] We then consider the electoral experiences of Chicago, Illinois; Philadelphia, Pennsylvania; and Cleveland, Ohio, as control cities to show that RCV has little to do with minority representation.[6]
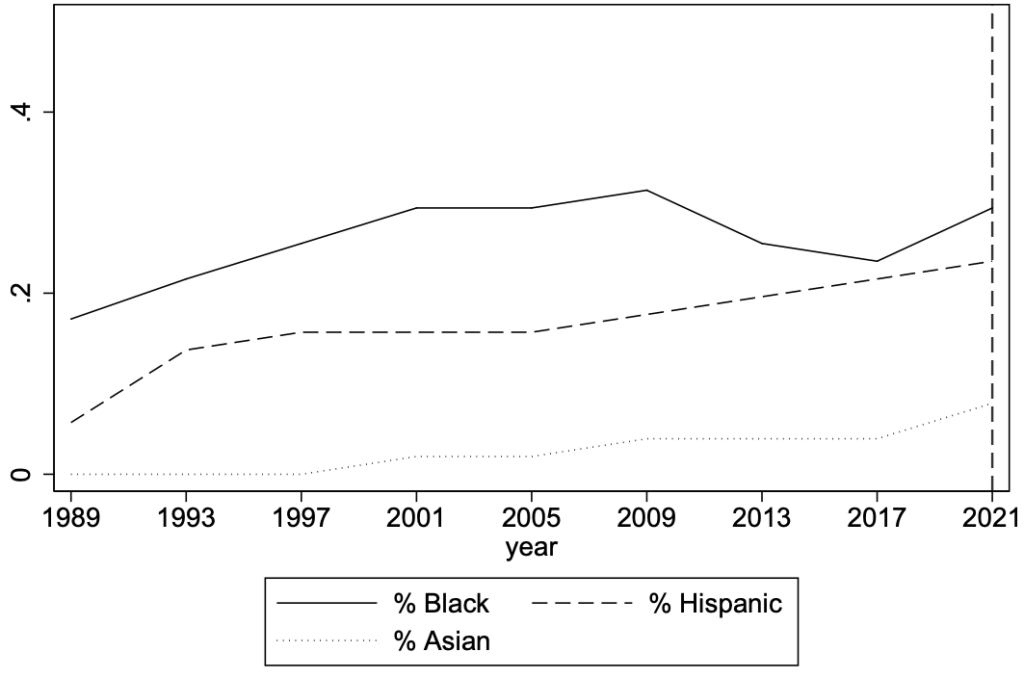
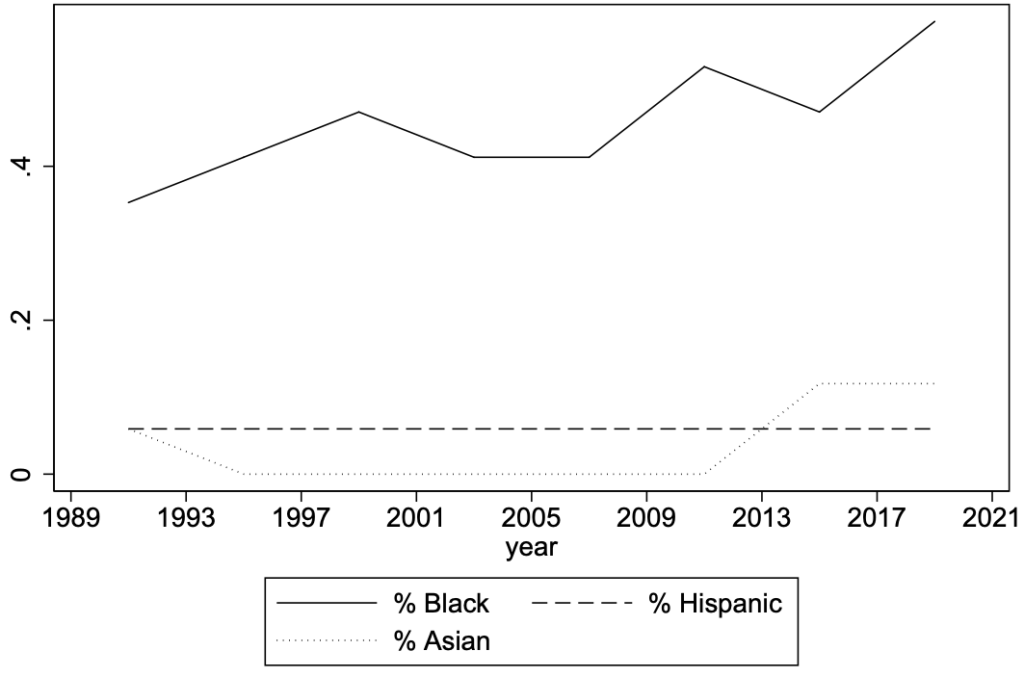
We begin with the patterns of minority representation for the RCV cities. These trends are shown in Figure 1. Separate lines are shown for the percentages of Black, Hispanic, and Asian representatives, and a vertical dashed line indicates the first election held under RCV. The figures cast doubt on FairVote’s claims that RCV caused an increase in minority representation. First, consider the New York City plot. Consistent with FairVote’s data, the total percentage of minority council members did rise in 2021. But those numbers were rising for some time under plurality elections. The number of Hispanic and Asian members were growing for over a decade. While there was a disproportionate increase in Black representation in 2021, it more or less represents a return to the level of a decade earlier, reversing declines in the 2013 and 2017 elections.
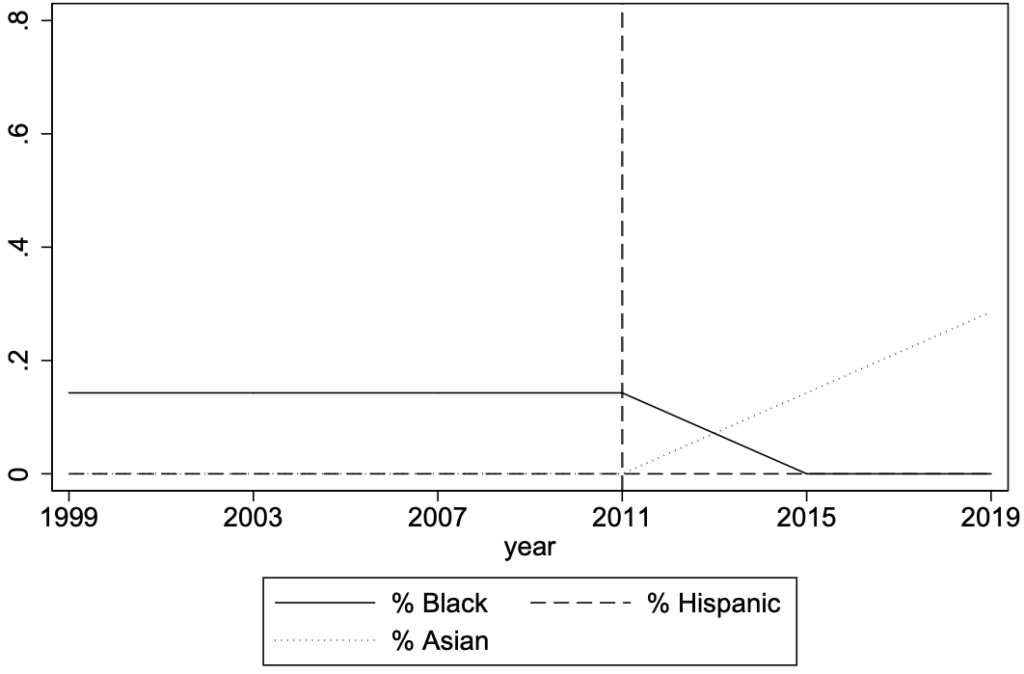
The Minneapolis and Saint Paul patterns are even less supportive of FairVote’s claims. In Minneapolis, Black representation actually decreased shortly after RCV adoption and remained at a low level through the 2013 election before beginning to grow again. In Saint Paul, Black representation was flat after RCV adoption and thereafter actually decreased. The increase in Asian representation in Saint Paul began years after RCV was adopted, indicative of other dynamics at work rather than the alleged magic of RCV.[7]
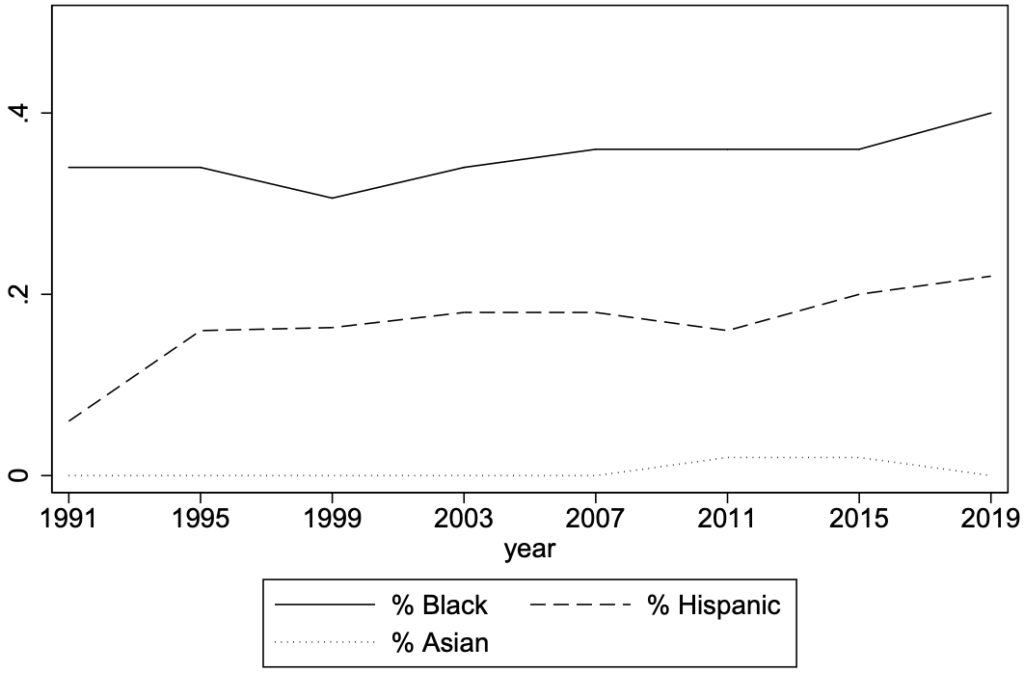
Figure 2, which shows the trends for the non-RCV cities (the control cities), also undercuts the FairVote argument. In Chicago and Philadelphia, there are strong trends towards greater representation of Blacks and Hispanics without the help of RCV. In fact, Chicago recently elected its most diverse council ever.[8] There is no trend for Cleveland, but that is largely because Blacks have been represented approximate to their population for two decades under plurality voting. So clearly the failure to compare the RCV cities against similar non-RCV cities leads to a misleading perception of minority group and female gains as a result of RCV. The evidence is to the contrary.
Figures 3 and 4 demonstrate similar problems with respect to FairVote’s analysis of gender representation.
Figure 1: Trends in the Racial and Ethnic Composition of RCV City Councils
Composition of New York City Council
Composition of St. Paul City Council
Composition of Minneapolis City Council
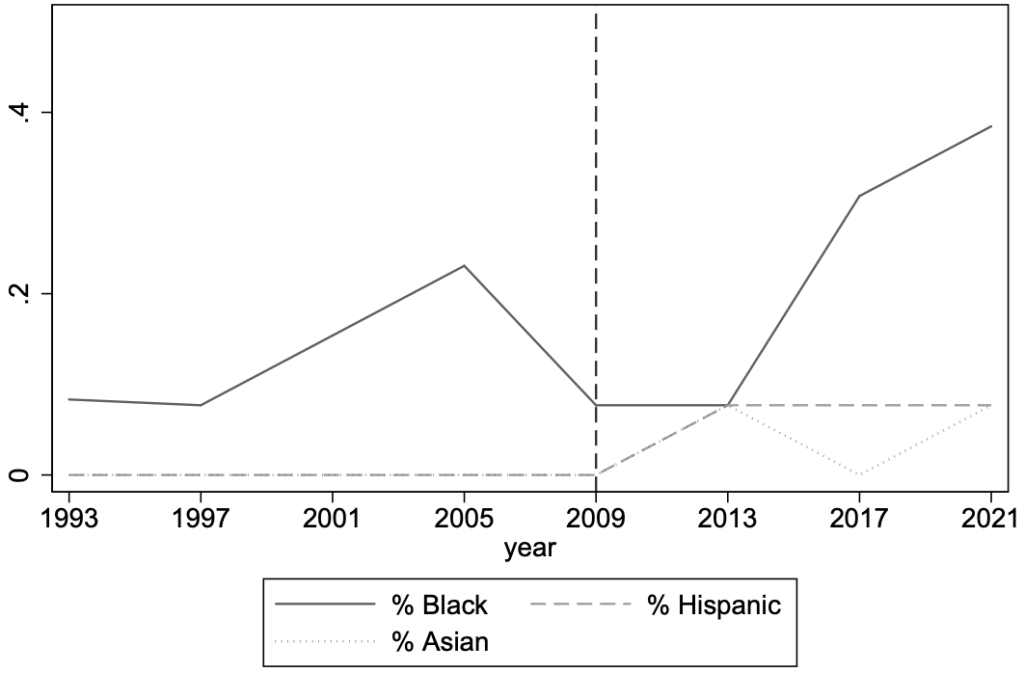
Figure 2: Trends Racial and Ethnic Composition of Non-RCV City Councils
Composition of Chicago City Council
Composition of Philadelphia City Council
Composition of Cleveland City Council
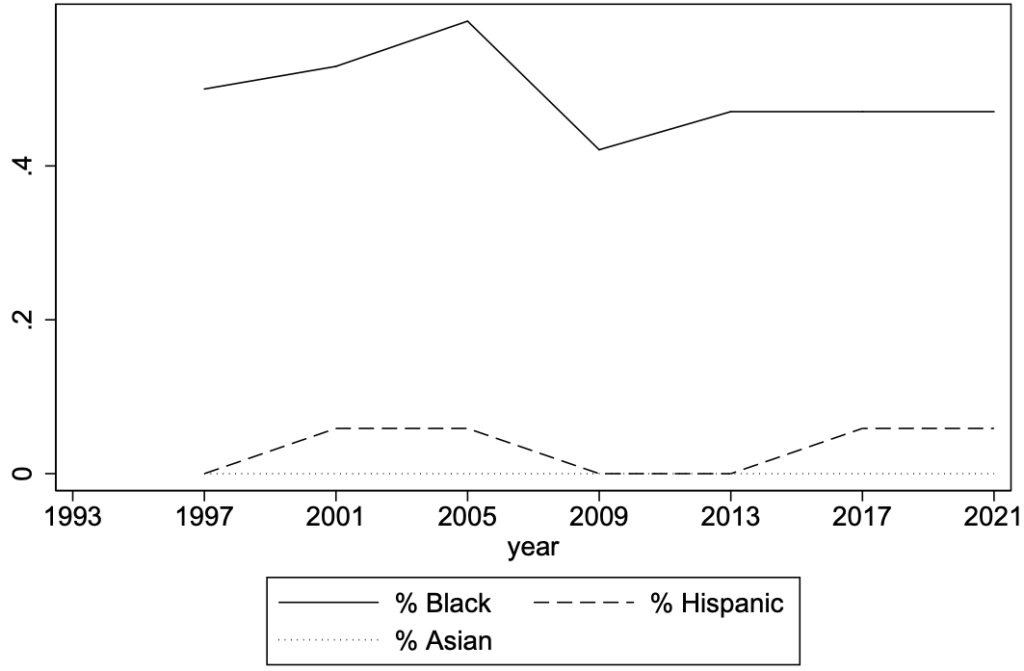
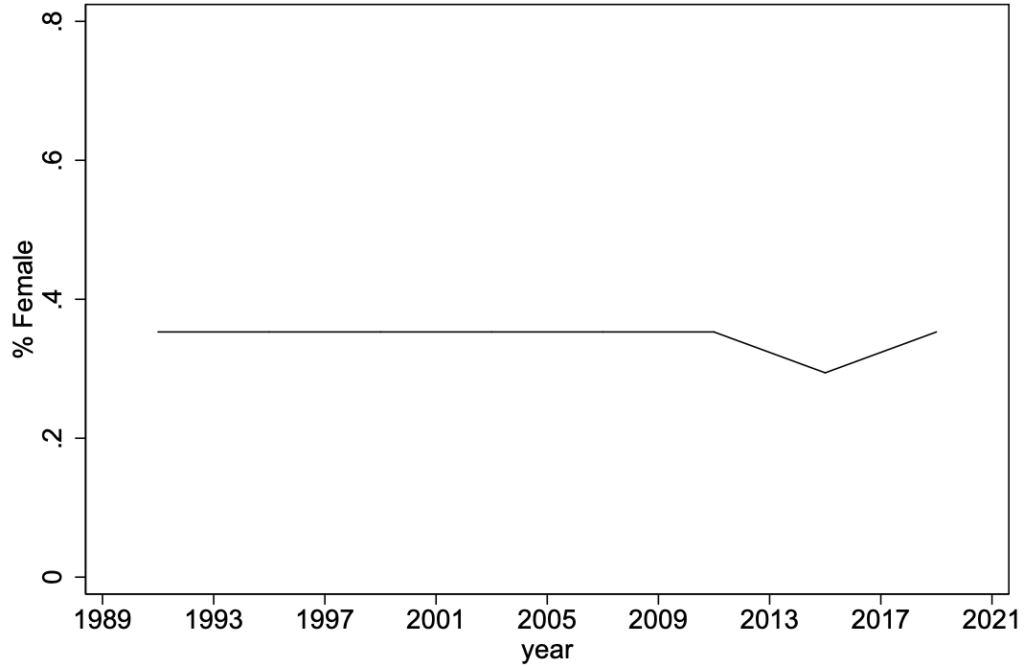
Figure 3: Trends in Gender Composition of RCV City Councils
Gender Composition, New York City Council
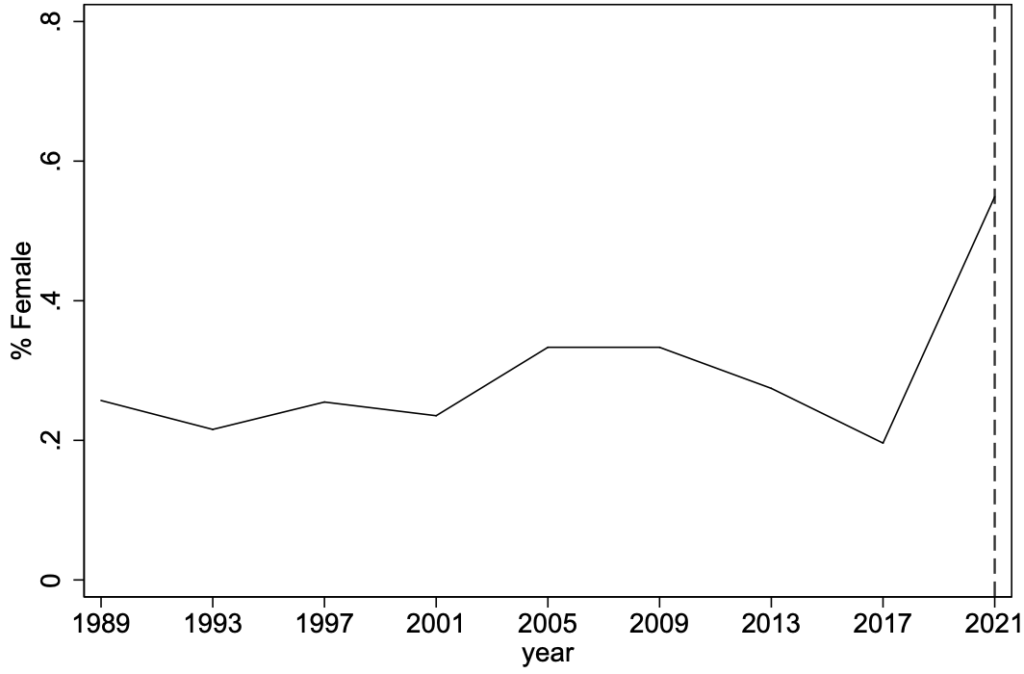
Gender Composition, St. Paul City Council
Gender Composition, Minneapolis City Council

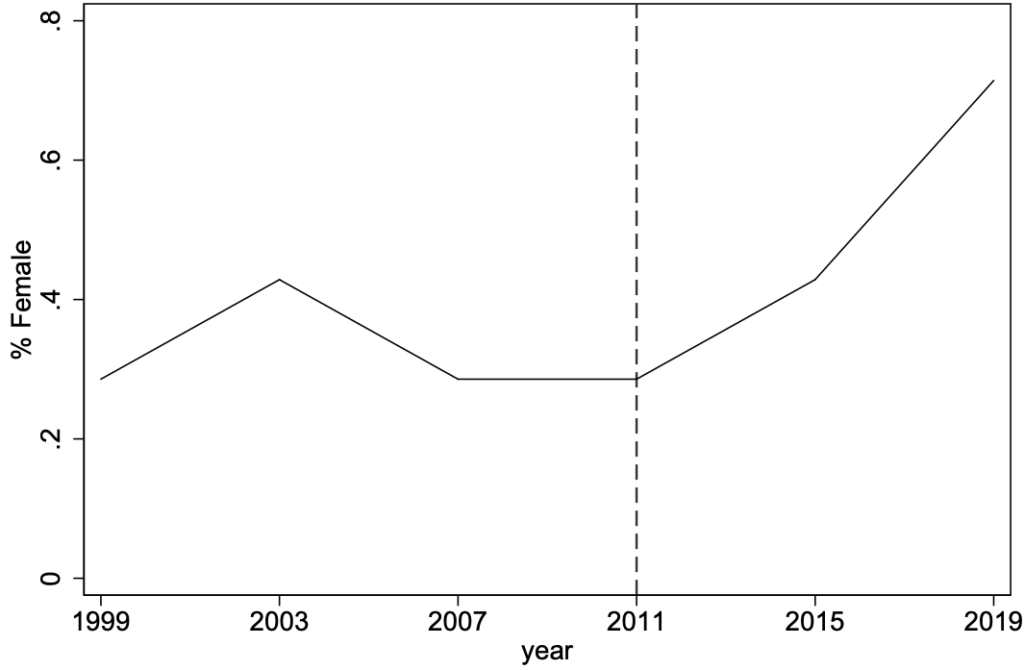
Figure 4: Trends in Gender Composition of Non-RCV City Councils
Gender Composition, Chicago City Council

Gender Composition, Philadelphia City Council
Gender Composition, Cleveland City Council
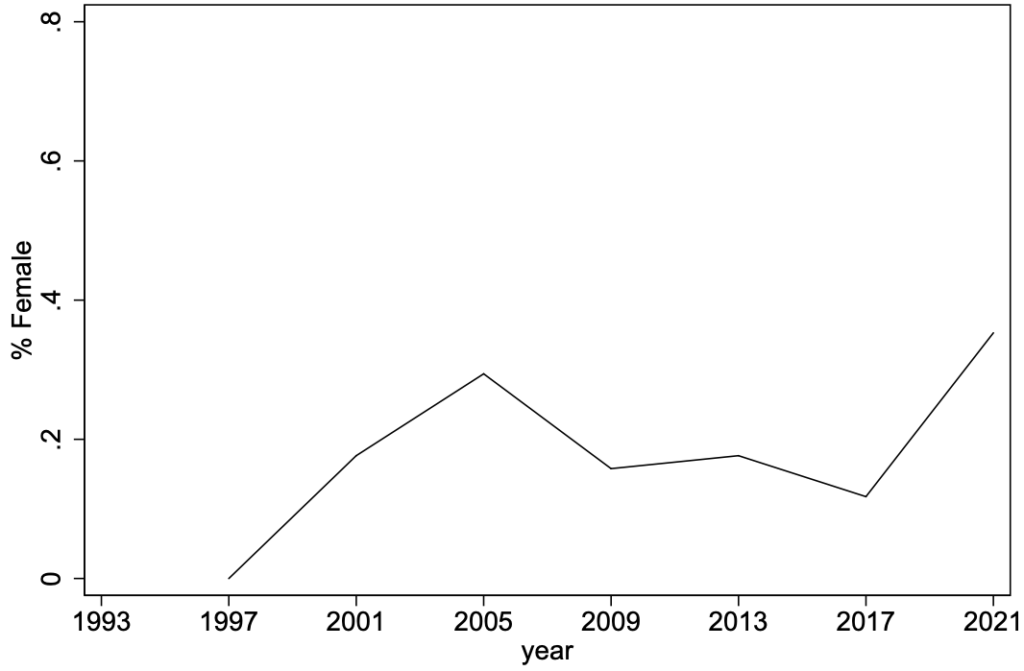
New York and Saint Paul do show increases in female representation following RCV adoption. But the trend for Minneapolis is flat for a decade following adoption. Meanwhile, two of the three non-RCV cities also show increasing numbers of female members in their councils. So RCV appears neither necessary nor sufficient to explain increases in female representation in city councils.
The upshot here is that FairVote’s data is inadequate to prove its claims. A proper study would include a far larger set of RCV cities that would be matched against otherwise similar non-RCV cities. The research design would then ask whether minority and female representation increases upon adoption of RCV relative to the control cities.
FairVote does cite one scholarly article that attempts such an analysis.[9] But that paper is very limited and arguably flawed. First, it is based on a very small number of cities – the four RCV cities in northern California (Berkeley, Oakland, San Leandro, and San Francisco). Seven other northern California cities are used as controls. So not only is the sample small, it is not representative of RCV adopters nationwide. But most importantly, the findings are not very supportive of the FairVote claims. They find only an advantage for non-white female candidates under RCV. There is no effect for minority men or white women. But here’s the critical limitation, among several, of the findings of that study: the study does not find an actual increase in the election of minority women in the RCV cities, but rather the finding is driven by a decrease in the representation of such women in the non-RCV control cities.
2. Candidates of Color Continue to Benefit from the RCV Counting Process.
In this section, FairVote reports on an analysis of the changes in the vote share between the first and final tabulation rounds for candidates of different racial and ethnic identities. The headline claim is that White candidates increase their vote share by 12% over the course of RCV tabulation, whereas Black candidates increase theirs by 15%.[10]
The accuracy and relevance of this claim are difficult to evaluate for a number of reasons. First, FairVote does not disclose what sample of RCV elections it has used. The methodology only applies to multiracial/multiethnic elections, and the criteria of how these were selected is not provided.[11] Second, the differences across racial and ethnic groups are fairly small, and no measures of the statistical uncertainty in the estimates are provided. So one cannot assess whether the differences across groups are statistically significant.
Most importantly, it is not clear what the findings are supposed to illustrate. FairVote suggests that the data indicates that minority candidates have benefited more from coalition-building opportunities afforded by RCV than have White candidates. But this is far from intuitive and need not be the case. If, for example, voting were racially polarized (and studies indicate RCV increases racial polarization), one would expect transfers from eliminated minority candidates to disproportionately go to one of the remaining viable minority candidates.[12] So if there were more White candidates, each would gain relatively less than the typical minority candidate.
Also, the FairVote finding is consistent with that of Professor McCarty in his report for CEC, which shows minority electorates have very high rates of ballot exhaustion when there are no co-racial or co-ethnic candidates in the final round of tabulation.[13] This effect reduces the transfer rate to White candidates. High exhaustion rates do not benefit minority voting communities. To the contrary, disproportionately high exhaustion rates among Black voters where there is no Black candidate standing in the final round harm Black voting influence.
Further, candidates who finish the first round near the 50% threshold will likely see smaller increases over the course of tabulation because once they reach the threshold, the election is over. A candidate who wins 45% in round one will typically not receive transfers much beyond 5% whereas one who started with 35% may obtain transfers on the order of 15%. Therefore, the finding might be explained by White candidates performing better on average in round one. FairVote’s glaring failure to account for these dynamics renders its claims superficial at best.
From Figure 6, FairVote argues that the racial and ethnic gaps are even larger when looking at winner vote shares.[14] But the same objections listed above continue to hold with the added caveat that winning candidates are not necessarily representative of all candidates. Moreover, the issues of statistical significance will be larger given that there are far fewer candidates used to estimate the vote share increases reported in Figure 6.
3. Candidates of Color Pay No Penalty When Running Against Candidates of the Same Race.
In this section, FairVote argues that minority candidates are not penalized by running against candidates of the same race because they will receive a disproportionate number of transfers when co-racial and co-ethnic competitors are eliminated. Similar to the findings of the last section, this finding may simply be a reflection of the persistence of racially polarized voting under RCV – which is not a positive aspect of RCV but rather a negative aspect. Thus, FairVote may have inadvertently documented a negative aspect of RCV.
It is also not clear how the transfer percentages were computed. There are several plausible measures, but the measures used to render the rates consistent with Figure 7 are not disclosed.[15] But even if the calculation were transparent, it would be difficult to translate the percentages into actual vote gains. For example, a candidate with a small vote total may be eliminated and all of her votes transferred to a single candidate. This would represent a small number of votes, but a large percentage transfer. Alternatively, a candidate with a large vote total could be eliminated and have her votes spread over several candidates. Such transfers might be low in percentage terms but large in terms of the absolute number of votes. Thus, it is hard to evaluate how much minority candidates actually benefit from the transfer rates show in Figure 7.
4. Voters of Color Continue to Demonstrate the Tendency to Rank More Candidates than White Voters.
In Figure 8, the FairVote report plots the percentage of candidates ranked in the 2022 Oakland mayoral race against the racial and ethnic demographics of each precinct.[16] The upshot is that voters in heavily White and Asian precincts ranked fewer candidates than did the heavily Black or Hispanic precincts. As FairVote’s earlier reports concede, however, racial and ethnic patterns in ballot usage can vary tremendously with context, especially with respect to the racial and ethnic identities represented in the candidate pool.[17]
With that caveat in mind, the Oakland results are not surprising. Among the top five candidates, there was one Asian (the ultimate winner), two Blacks, and two Hispanics. Critically, racially-polarized voting would easily produce a pattern where Black and Hispanic voters ranked more candidates than White or Asian voters. Thus, FairVote’s data may document racially polarized voting, a negative aspect observed in RCV elections, rather than systematic exercise of robust choice by minority voters in RCV elections, which is the conclusion FairVote claims.
To begin analyzing which dynamic is really at work, Professor McCarty’s study of the 2021 New York City mayoral primary found that Black, Asian, and Hispanic electorates cast fewer votes than White electorates and were more likely to only vote for one candidate.[18] So there does not appear to be any general pattern with respect to ballot usage across ethnic and racial groups.[19]
A second issue is that ranking more candidates – FairVote’s measure – is no guarantee that voters will not exhaust their ballots. Indeed, many RCV elections feature large numbers of ballot exhaustions among voters who mark preferences for multiple non-competitive candidates who are eliminated before the final round, meaning that those voters are not influential in the final selection of the winning candidate – the negative effect of disproportionate minority voter exhaustion measured by Professor McCarty. By contrast, voters who support one of the two strongest candidates need rank only one candidate to avoid exhaustion and cast an effective vote that influences the outcome. FairVote does not address the evidence provided in Professor McCarty’s study that minority electorates are considerably more likely to exhaust their ballots, especially in situations where there is not a co-racial or co-ethnic candidate among the finalists.[20]
5. Other FairVote Claims
The FairVote report makes a number of other claims which are unreliable, misleading, or have limited value in assessing the appropriateness of adopting RCV.
The first is based on a small survey that FairVote conducted about RCV support and ease of use. The target population was permanent residents and naturalized citizens. The main finding is that this group of U.S. residents generally support RCV and think it would be easy to use. The first issue with this evidence is that it seems unlikely that the respondents have been exposed to the full debate on the benefits and costs of RCV, so they are very unlikely to have fully formed views on the subject. Second, the respondents’ exposure to the mechanics of RCV was limited to being asked to rank the 2024 presidential candidates. This is a far easier task than, for example, ranking all of the candidates in a city council election.[21] Finally, survey evidence of this sort is of limited value in determining whether a new electoral system is appropriate.
Additionally, even entertaining FairVote’s reliance on polling data as proof of its fairness, its reliance on superficial polling support for RCV ignores the problematic practical experiences documented by a number of voting rights organizations who have expressed concerns about RCV and its impact specifically on minority voters.[22]
For example, the Oakland branch of the NAACP recently questioned whether minority voter exhaustion tipped the result of the 2022 mayoral election against a Black candidate by 677 votes:
Now, the Oakland branch of the NAACP says there should be a recount, not to change the outcome, but to get a better understanding of how little voters understand the city’s ranked-choice voting system.
Ranked-choice voting was promoted in Oakland as a way to save money, eliminating the need for costly run-off elections. But opponents say it’s also sowing mistrust of the voting process, especially in minority communities.
… The NAACP also said about 11,000 ballots were reported as “exhausted,” meaning they didn’t include all five choices. They believe that’s an indication of how poorly the community understands the process.[23]
Recent professional studies, including Professor McCarty’s study for CEC, indicate those concerns are warranted and that additional study of RCV is needed before one can accept FairVote’s claims that RCV treats minority voters fairly.
A second claim is the suggestion that RCV voting contributed significantly to the election of Alaskan native Mary Peltola to a U.S. House seat under Alaska’s Top 4 RCV system. But as Prof. McCarty pointed out in his study, the RCV rankings in the race suggest that under the old system of a partisan primary and a plurality general election, Peltola would have easily won the Democratic nomination and then defeated the predicted Republican nominee, Sarah Palin. FairVote conveniently ignores the impact of RCV in any other Alaska election, but Prof. McCarty showed that Alaskan native ballots were exhausted at disproportionately high rates in almost every other Top 4 election that year.[24]
Finally, FairVote selects one anecdotal primary contest to support its claims. FairVote presents a case study of the 2023 Democratic Primary in the 9th NYC Council District highlighting the fact that two candidates – Yusef Salaam and Al Taylor – cross-endorsed each other. Such cross-endorsements and “positive” campaigning are often touted as features of RCV. FairVote’s narrative and Figure 11 imply that the cross-endorsement was consequential in Salaam’s victory.[25] However, Salaam finished the first round just 9 votes short of an absolute majority and won the election in round 2 when he was transferred 21 of the write-in ballots. The cross-endorsement agreement with Taylor was completely inconsequential.[26] As any lay observer of recent RCV elections can readily attest, RCV elections from Alaska to Maine have featured highly negative campaigning, so the selection of one isolated cross-endorsement in one NYC Democratic primary election hardly proves FairVote’s utopian claim.
6. Conclusions
There are many gaps in the academic literature on the effects of Ranked Choice Voting on minority candidates and voters. Into these gaps, FairVote has attempted to insert a number of misleading claims based on incomplete, superficial, and cherry-picked evidence. CEC will continue to support scientifically rigorous scholarship on RCV to ensure that states and localities have a complete picture of this system of voting before they consider adopting it.
[1] Nolan McCarty, “Minority Electorates and Ranked Choice Voting,” Jan. 10, 2024, available at Center for Election Confidence, “Minority Electorates and Ranked Choice Voting,” (2024), https://electionconfidence.org/ranked-choice-voting-hurts-minority-voters.
[2] See Sabrina Laverty & Deb Otis, “Ranked Choice Voting Elections Benefit Candidates and Voters of Color: 2024 Update,” FairVote (Jan. 2024), https://fairvote.org/report/communities-of-color-2024/.
[3] Deb Otis, et al., “Ranked Choice Voting Elections Benefit Candidates and Voters of Color,” FairVote (May 2021),https://fairvote.org/report/report_rcv_benefits_candidates_and_voters_ of_color/.
[4] Justin de Benedictis-Kessner, et al., “American Local Government Elections Database,” 10 Scientific Data 912 (2023), https://www.nature.com/articles/s41597-023-02792-x. The Local Elections Government Database uses machine-learning algorithms based on first name, surname, and local demographics to estimate the racial, ethnic, and gender identities of over 78,000 local candidates who ran for local office over the past thirty years.
[5] Salt Lake City, Utah, is excluded because its very small size makes it hard to draw inferences about its trends. Of the seven-member Salt Lake City Council after the first RCV election in 2021, three members were Hispanic and one was Asian. The Asian member was appointed to a seat before 2021 but barely won reelection, running well behind the other candidates. One of the Hispanic members was elected in 2019 under plurality voting. Of the pickups in 2021, both Hispanic candidates were elected in heavily Hispanic districts which could well have elected a Hispanic under any voting rule. Moreover, the runners-up were a Hispanic and an African-American. See Kem C. Gardner Policy Institute, David Eccles School of Business, The University of Utah, “Salt Lake City 2022 Data Book,” https://d36oiwf74r1rap. cloudfront.net/wp-content/uploads/SLC-Data-Book-2022.pdf. Therefore, it is hard to assess what role RCV played in those outcomes.
[6] The selection criteria are large racially diverse Northeastern and Midwestern cities with single-member plurality elections so as to closely approximate what might have happened in New York, Saint Paul, and Minneapolis had they not adopted RCV when they did. Both the RCV and the control cities elect all members on a four-year cycle.
[7] The data stops in 2021, but it is worth noting that the Saint Paul Council did add two Black members in 2023. But Black voters lacked descriptive representation on the council for most of the post-RCV period.
[8] See Edward Robert McClelland, “We Have the Most Diverse City Council in Chicago History,” Chicago Magazine, June 2, 2023, https://www.chicagomag.com/news/we-have-the-most-diverse-city-council-in-chicago-history/.
[9] Sarah John, et al., “The Alternative Vote: Do Changes in Single-member Voting Systems Affect Descriptive Representation of Women and Minorities?,” 54 Electoral Studies 90 (2018), https://www.sciencedirect.com/science/article/abs/pii/S0261379417304006.
[10] See Laverty, supra note 2, Figure 5.
[11] The report also does not describe how the data on candidate racial and ethnic identities was compiled.
[12] For evidence that RCV may actually exacerbate racially-polarized voting, see Jason A. McDaniel, “Does More Choice Lead to Reduced Racially Polarized Voting? Assessing the Impact of Ranked-Choice Voting in Mayoral Elections,” 10 California Journal of Politics and Policy 1 (2018), https://escholarship.org/uc/item/2gm5854x.
[13] McCarty, supra note 1.
[14] Laverty, supra note 2, Figure 5.
[15] Id., Figure 7.
[16] Id., Figure 8. The report labels the mayoral election as occurring in 2023, but it was actually held in 2022.
[17] See Deb Otis, “What We Learned from New York City’s Second Ranked Choice Voting Election,” FairVote (2023), https://fairvote.org/report/rcv-in-nyc-report-2023/; Otis, supra note 3, at 13-15.
[18] See McCarty, supra note 1, at 41-42, Tables 9 and 10.
[19] There is also a technical issue with FairVote’s analysis. They examine the correlation between the population share and the percentage of candidates ranked one group at a time. This procedure may produce biased estimates, however. For example, the share of voters in group A may be correlated with the number of voters in group B. So not including the share of group B in the analysis of group A, the estimates are subject to omitted variable bias. For this reason, Professor McCarty includes the population shares of all groups in regression models of ballot usage and exhaustion. See McCarty, supra note 1.
[20] See McCarty, supra note 1.
[21] Unfortunately, the pro-RCV academic literature has used ranking presidential candidates as part of their research design for some time. See, e.g., Joseph Coll, “Demographic Disparities Using Ranked-Choice Voting? Ranking Difficulty, Under-Voting, and the 2020 Democratic Primary,” 9 Politics and Governance 293 (2021), https://www.cogitatiopress.com/politicsandgovernance/article/view/3913. But such tasks are far less informationally demanding than voting in the typical RCV election.
[22] Several NAACP organizations have expressed concerns about the use of RCV and/or its implementation and education efforts. See, e.g., Carl Campanile, “NAACP Head Dukes Slams Ranked Choice Voting, Urges Overhaul of Elections Board,” New York Post (July 1, 2021), https://nypost.com/2021/07/01/naacp-head-slams-ranked-choice-voting-urges-overhaul-of-board/; Jo DeVoe, “Ranked-Choice Voting Education Campaign is Underway but Arlington NAACP Says More Needs to be Done,” ArlNow.com (May 19, 2023), https://www.arlnow.com/2023/05/19/ranked-choice-voting-education-campaign-is-underway-but-arlington-naacp-says-more-needs-to-be-done/; Graham Moomaw, “How Uncertainty Sank Richmond’s Plan to be First to Adopt Ranked-Choice Voting,” The Virginia Mercury (Sept. 13, 2022), https://www.virginiamercury.com/2022/09/13/how-uncertainty-sank-richmonds-plan-to-be-first-to-adopt-ranked-choice-voting/ (“At the meeting earlier this month, representatives from the Richmond chapter of the NAACP spoke against ranked-choice voting … ‘I don’t think Richmond is ready for it,’ said James “JJ” Minor, president of the Richmond NAACP. ‘A majority of Americans don’t know anything about it.’”); Lee Eric Smith, “Memphis NAACP Changes Course, Says ‘Not Right Now’ to Instant Run-Off Voting,” TriStateDefender.com (Nov. 30, 2017), https://tri-statedefender.com/naacp-instant-runoff-voting/11/30/.
[23] John Ramos, “NAACP Seeks Oakland Mayor’s Race Recount Amid Criticism of Ranked-Choice Voting,” CBSNews.com (Dec. 20, 2022), https://www.cbsnews.com/sanfrancisco/news/oakland-mayor-race-naacp-seeks-recount-ranked-choice-voting-criticism/.
[24] See McCarty, supra note 1.
[25] See Laverty, supra note 2, Figure 11.
[26] Moreover, the evidence in Figure 11 suggests that Taylor’s hypothetical transfers would have been roughly split between Salaam and the second-place candidate. See Board of Elections in the City of New York, 2023 Primary Election, Official Ranked Choice Rounds, June 27, 2023, https://vote.nyc/sites/default/files/pdf/election_results/2023/20230627Primary%20Election/rcv/DEM_Council_Member_9th_Council_District.pdf.